See it in the product
This is the actual product — not a concept.
● login.24observe.com
Overview · health + incidents 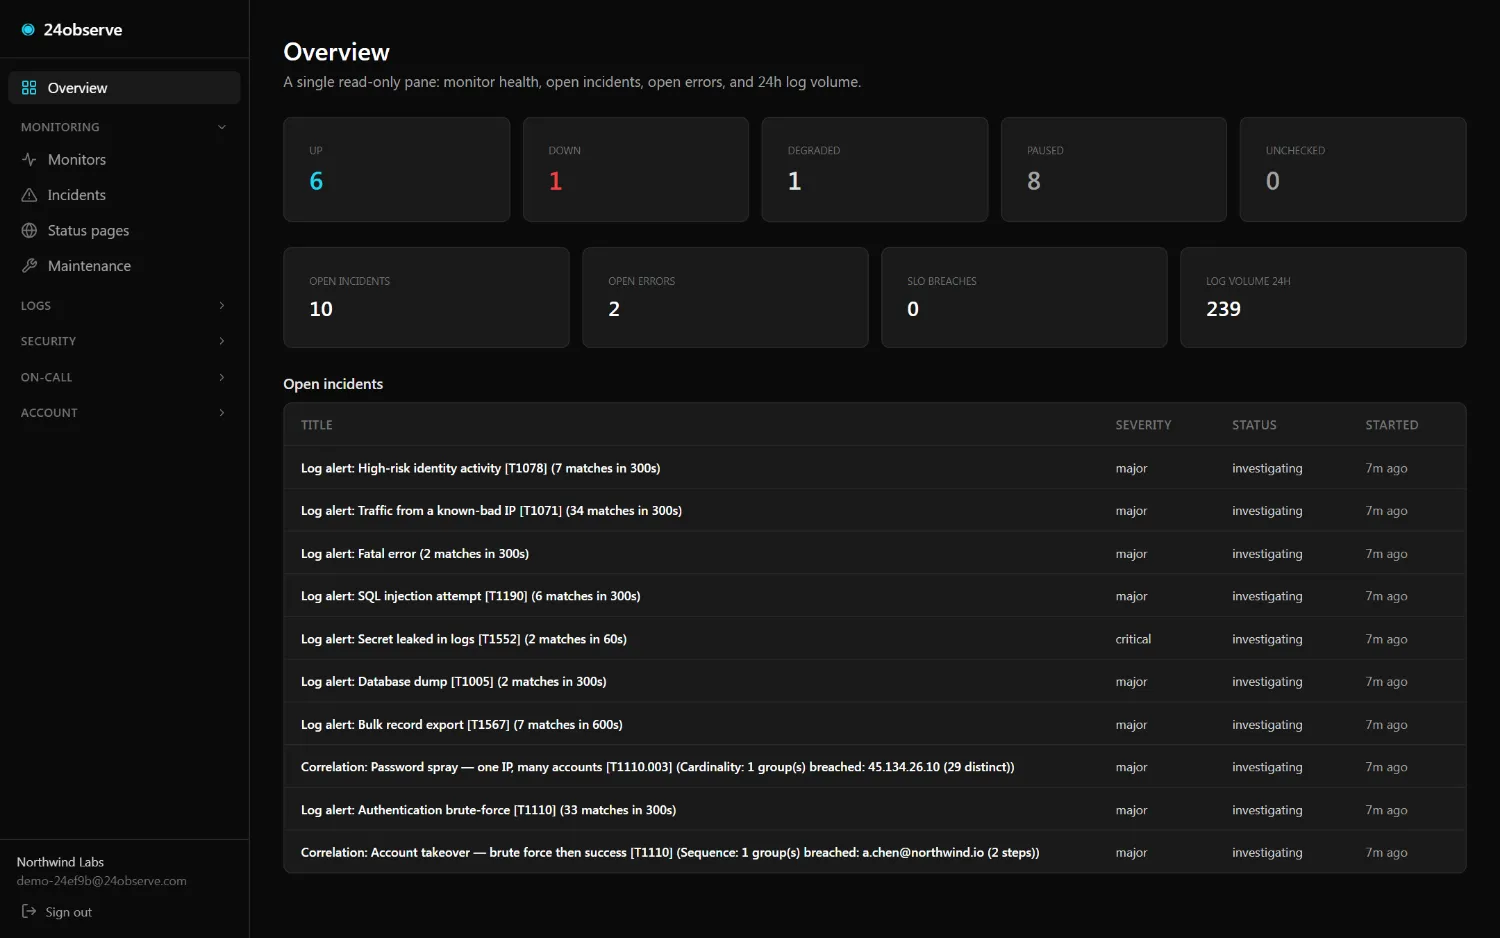
One platform watches your uptime, logs, and security — and an AI analyst investigates every incident. It walks a live map of your services, hosts, identities, and AI agents, blames the change, confirms it in the metrics, and hands you an evidence-backed verdict — root cause and the next move — in seconds. Not another red dot.
Uptime, logs, a real SIEM, and AI-agent security — unified, investigated by an AI analyst, and drivable by your agents. Skim it; each links to the detail.
HTTP, TCP, SSL, ping, keyword, heartbeat, browser — multi-region, with SLO targets.
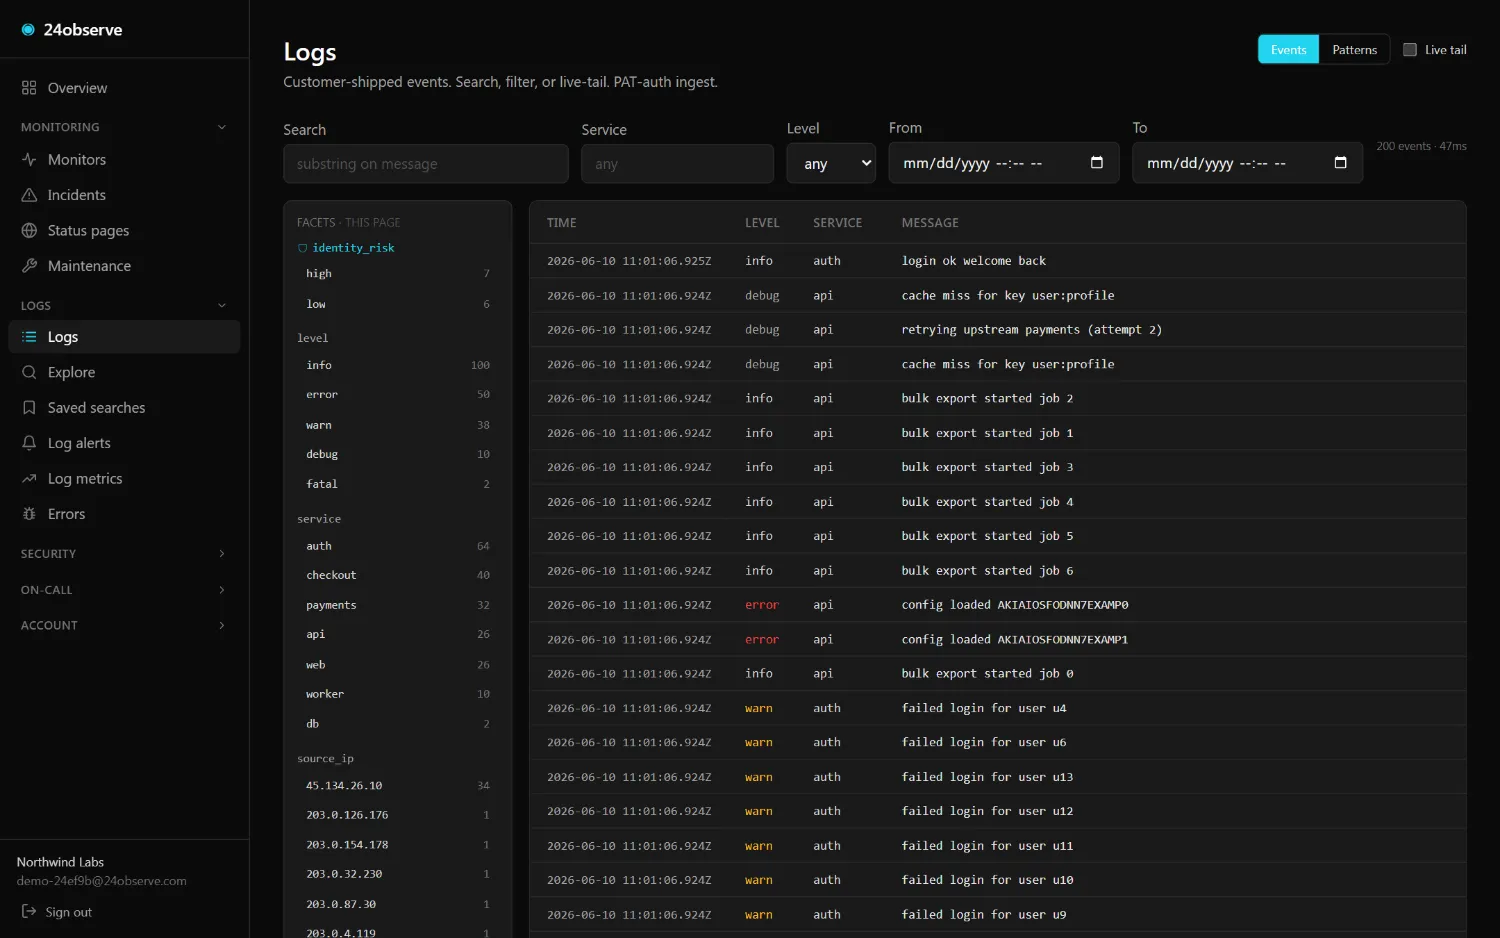
Learn more →Ship from anywhere, search in the words you remember, group patterns, track errors.
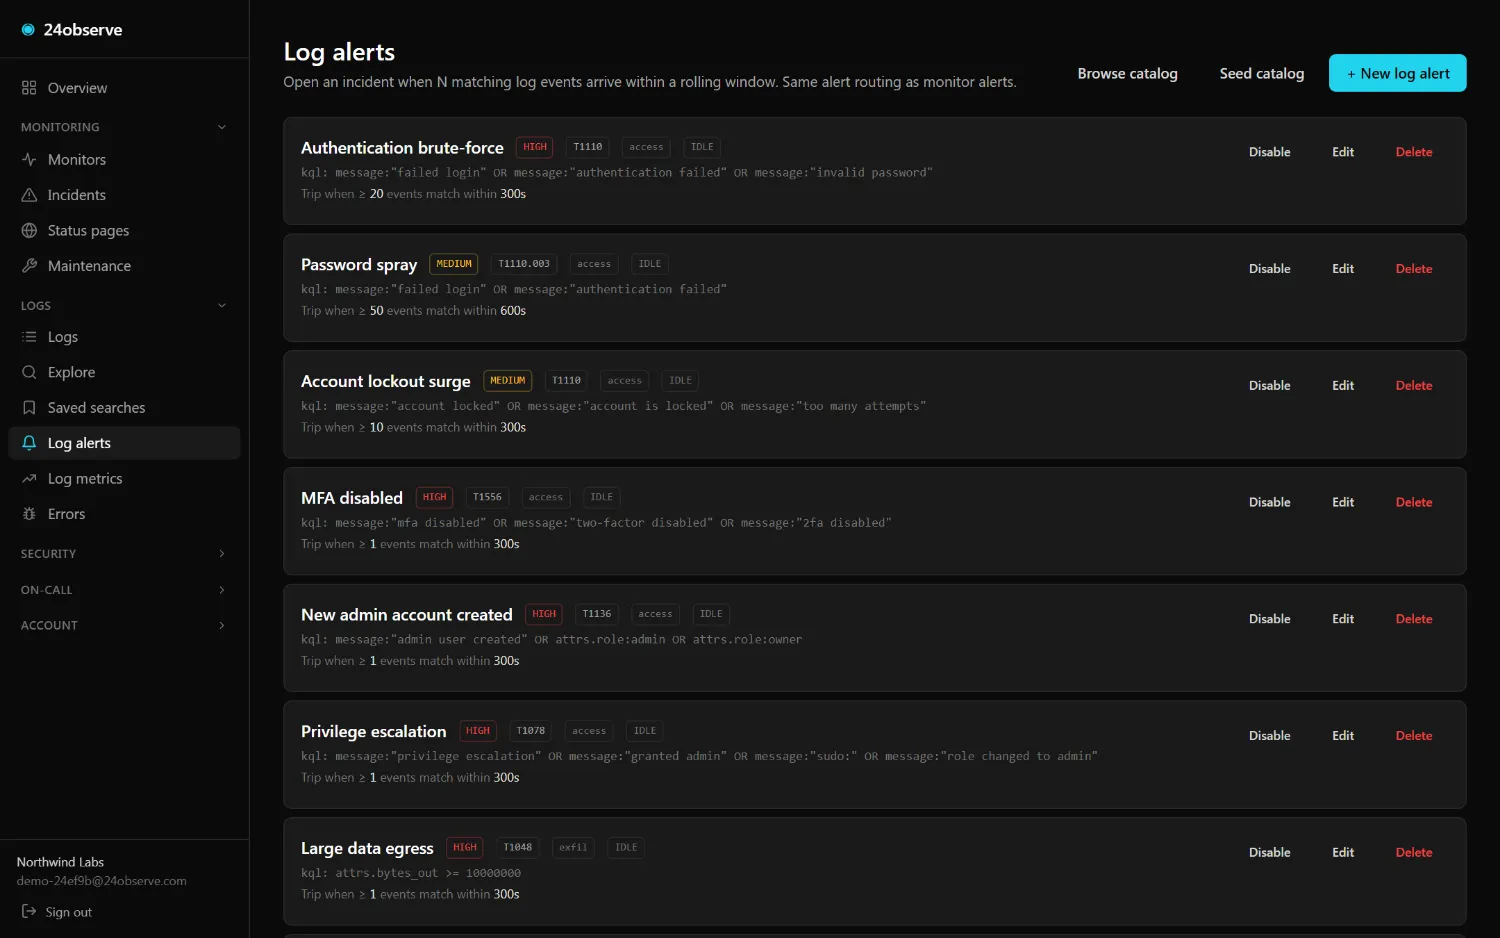
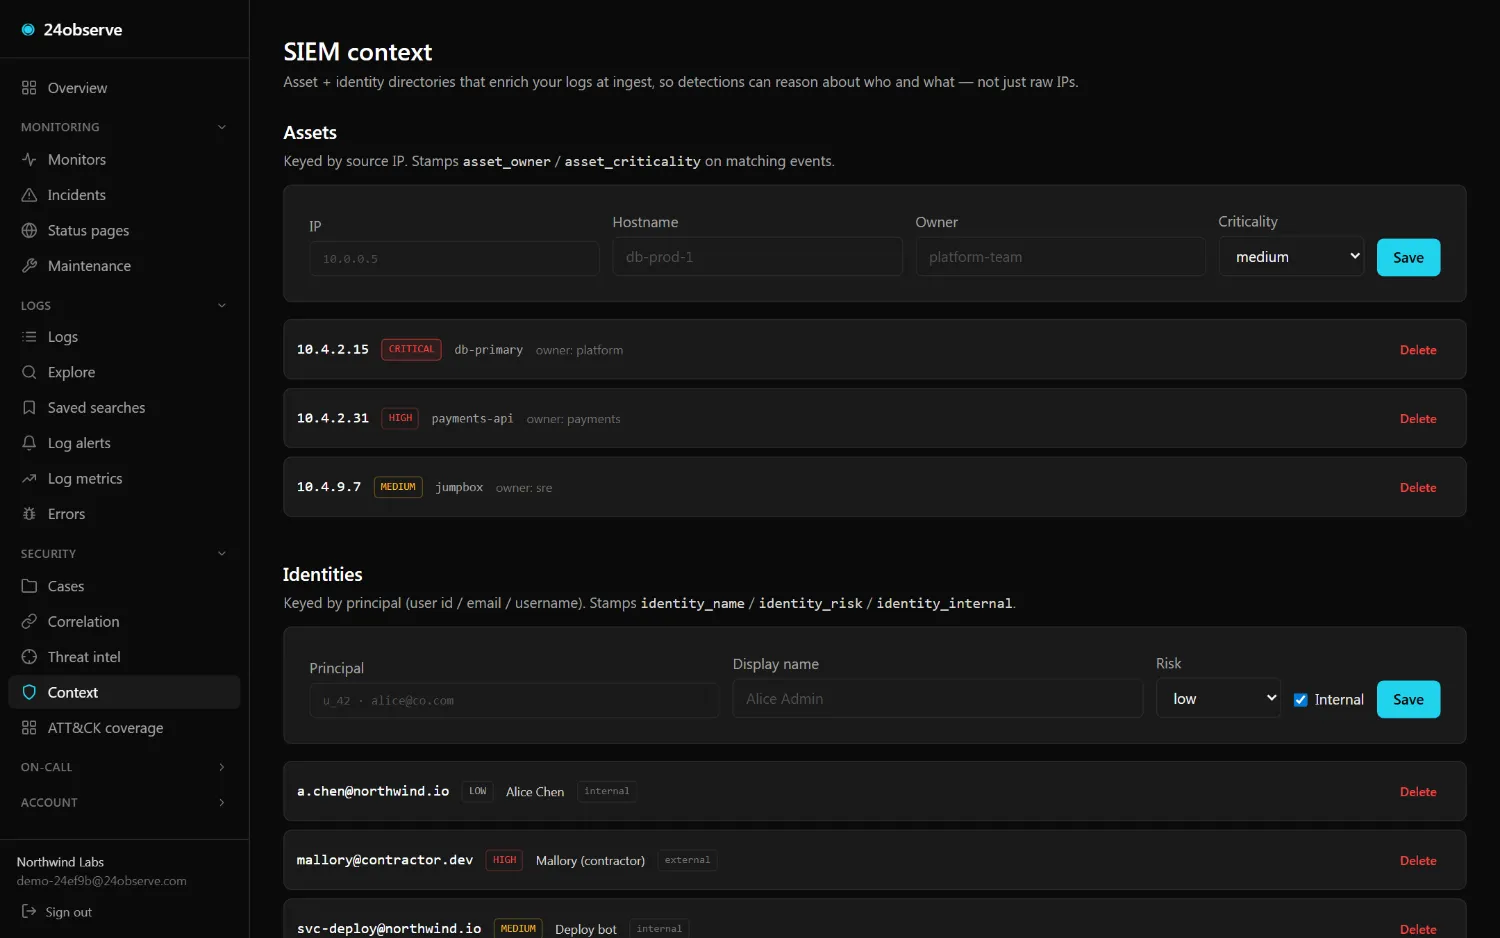
Learn more →ATT&CK-tagged rules, multi-event correlation, threat-intel matched at ingest.
Learn more →An AI analyst gathers the evidence and returns a cited verdict — not another alert.
Learn more →Services, hosts, identities, and agents linked — the analyst walks it to find root cause.
Learn more →Prompt injection, runaway tool loops, token & cost abuse — surfaced as detections.
Learn more →CrowdStrike, Okta, CloudTrail, and more — or any source via universal ingest.
Learn more →Pure REST, an MCP server, and pre-converted tool defs for OpenAI, Anthropic, LangChain.
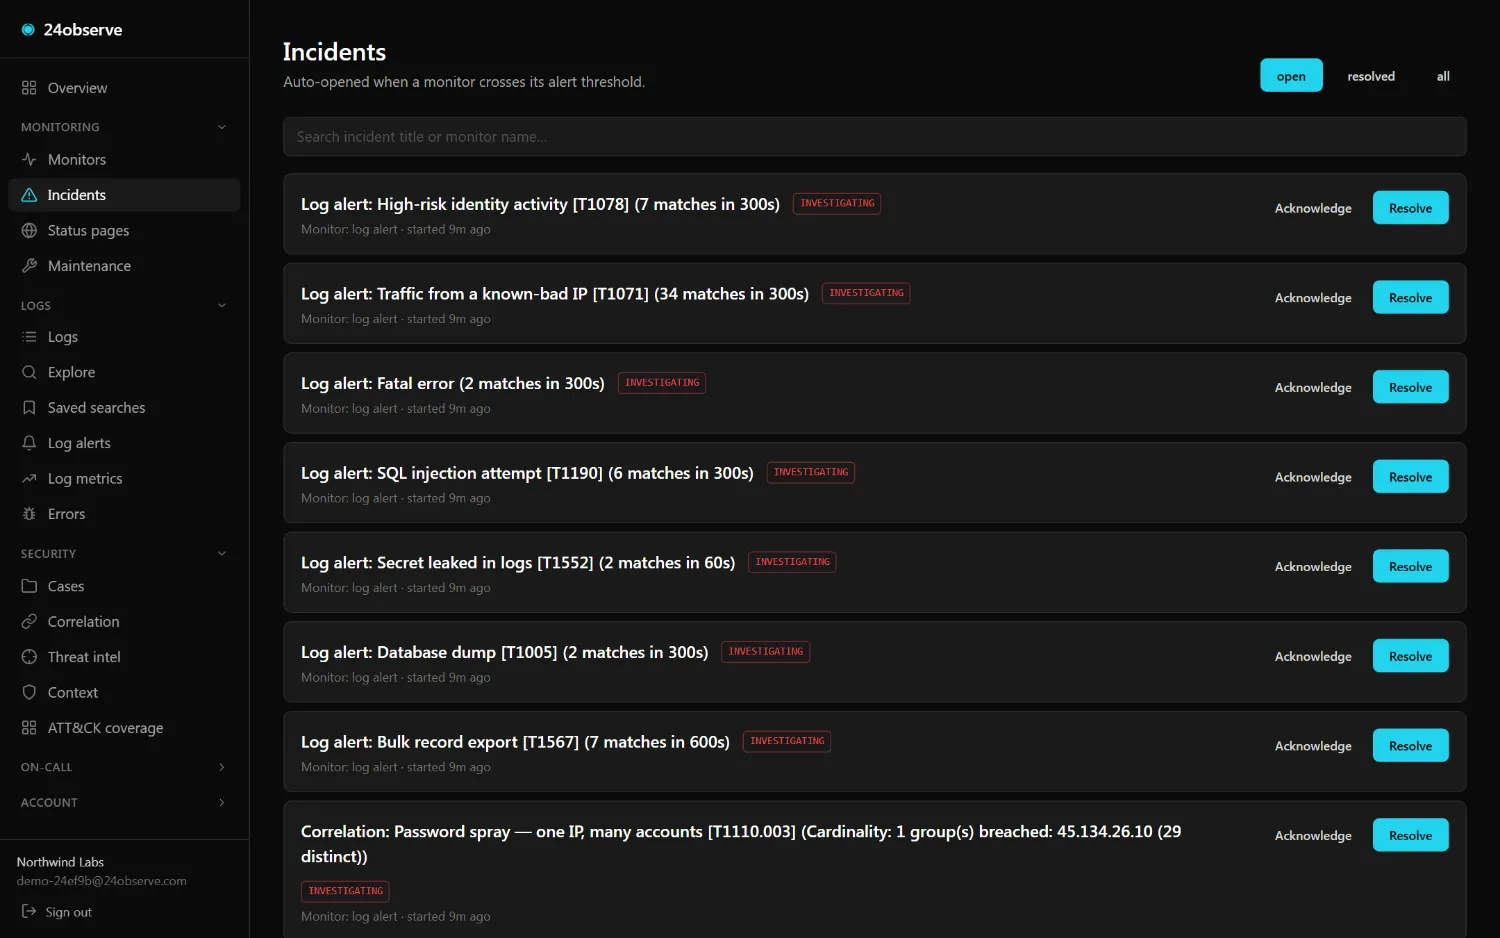
Learn more →Most tools hand you a wall of red and wish you luck. Ours investigates. For every incident, the analyst pulls the blast radius, the recent changes, and the metrics, decides whether it's a security or an operational problem, and returns a cited verdict — disposition, confidence, and the recommended next move — in seconds. When the signal is too thin, it says so and asks for a human. Validated on our own production telemetry.
Send your agents' OpenTelemetry GenAI spans and the same platform shows cost, latency, and error rate per agent and model — then flags prompt injection, runaway tool loops, and secret exfiltration as real detections, in the very same incident pipeline as everything else. The observability and security layer for the agents you're putting into production.
Uptime, logs, and the SIEM on one predictable bill — no per-host metering, no per-seat tax, no “security tier.” Start free; self-host free forever.
Sign up and we run it for you, or fork the source and run it yourself.